Appendix 4.1: Files Used to Generate Example 4.4
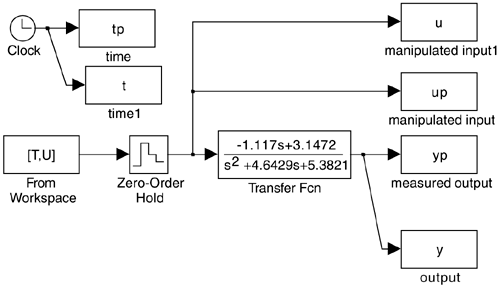
% use PRBS to estimate a discrete model of the vdv reactor
%
  T  = 0:0.25:5;       % time vector (row)
  T  = T';             % time vector (column)
  seed = [3;0.5];      % seed for noise generation
  randn('state',seed); % using the same seed each time
  uu = 0.5 1 0.25*randn(length(T),1); % mean of 0.5 with variance
%                       of 0.25
  U  = 2*round(uu)-1;  % creates PRBS with -1 and 1 values
%
  sim('est_vdv');      % runs simulation of linear van de vusse
%                        diagram
  figure(1);           % plot input-output data
  subplot(2,1,1),plot(tp,yp,'k',t,y,'ko');
  xlabel('time, min'), ylabel('y')
  title('PRBS estimation example')
  subplot(2,1,2),plot(tp,up,'k'); xlabel('time, min'),ylabel('u')
  axis([0 5 -1.1 1.1])
%                      % generate phi matrix for estimation
  for j = 4:22;
   phi(j-3,:) = [y(j-2) y(j-3) u(j-2) u(j-3)];
  end
%
  theta = inv(phi'*phi)*phi'*y(3:21)  % estimate parameters
%
  num = [theta(3) theta(4)];     % numerator of discrete transfer function
  den = [1 -theta(1) -theta(2)]; % denominator of discrete transfer function
  sysd = tf(num,den,0.25)        % create discrete tf object
  tzero(sysd)                    % calculate zeros
  pole(sysd)                     % calculate poles
  syszpk = zpk(sysd)             % zero-pole-k form
|